
Task Achievement In Writing Task 1
There are four criteria on which the examiner will base to mark your writing, one of which is Task Achievement; this means how well you answer the question.
Let’s look again at the wording of this Writing Task 1 question.
Summarize the information by selecting and reporting the main features and making comparisons where relevant.
Write at least 150 wards.
Complete the guidelines for a good score by filling in the gaps.
A. Give an overview of the _________ information.
B. Identify all the _________ relevant and significant _________ .
C. Highlight the main _________ and similarities in the information.
D. Do not include your own _________ or _________ for the data.
E. Make sure you write _________ than 150 words.
Sample Task
Getting Ready To Write
The graph below shows the number of visitors each month to the zoo’s most popular exhibits.
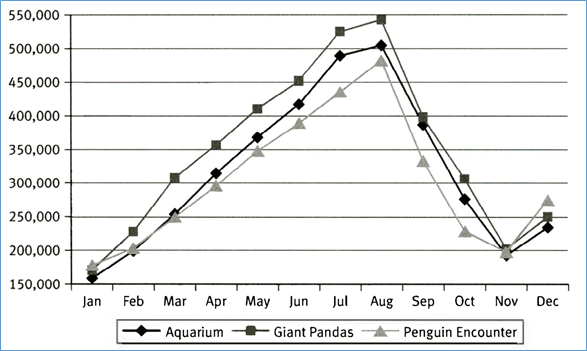
1. Look at the graph in the Sample Task and answer the questions
A. What is being measured?
B. How is this chart different to the pie chart in the previous exercise?
C. Is there a time element to this information? If yes, what is it?
D. Are two or more things being compared? If yes, what are they?
2. Look at the graph for just one minute now, and then answer the following questions.
A. What do you notice about pattern of visitor numbers to all the animals over the course of the year?
B. What do you notice about the different number of visitors to each animal in January and November compared to July?
C. What do you notice about the relative popularity of the pandas and the penguins for most of the year?
D. What do you notice about the relative popularity of the animals in January and December compared to the rest of the year?
Summarize the information by selecting and reporting the main features, and make comparisons where relevant.
Write at least 150 words.